Bioinformatics Portfolio
My coursework from BIMM 143. Showcasing genomic analysis techniques, introductory machine learning, and protein folding and structure prediction.
Class 12, pt. 2: Population Analysis
Aadhya Tripathi (PID: A17878439)
Population Scale Analysis
Q13. Read this file into R and determine the sample size for each genotype and their corresponding median expression levels for each of these genotypes.
# Import the file
results <- read.table("rs8067378_ENSG00000172057.6.txt")
head(results)
   sample geno      exp
1 HG00367  A/G 28.96038
2 NA20768  A/G 20.24449
3 HG00361  A/A 31.32628
4 HG00135  A/A 34.11169
5 NA18870  G/G 18.25141
6 NA11993  A/A 32.89721
Gives the sample size of each genotype:
table(results$geno)
A/A A/G G/G
108 233 121
Calculate the median expression:
AA <- results[results$geno == "A/A",]
AG <- results[results$geno == "A/G",]
GG <- results[results$geno == "G/G",]

median(AA$exp)
[1] 31.24847
median(AG$exp)
[1] 25.06486
median(GG$exp)
[1] 20.07363
A|A has a sample size of 108 and median expression 31.24847. A|G has a sample size of 233 and median expression 25.06486 G|G has a sample size of 121 and median expression 20.07363
Q14. Generate a boxplot with a box per genotype, what could you infer from the relative expression value between A/A and G/G displayed in this plot? Does the SNP effect the expression of ORMDL3?
Boxplot of the genotype vs expression:
library(ggplot2)
boxp <- ggplot(results) +
        aes(geno, exp, fill = geno) +
        geom_boxplot()

boxp
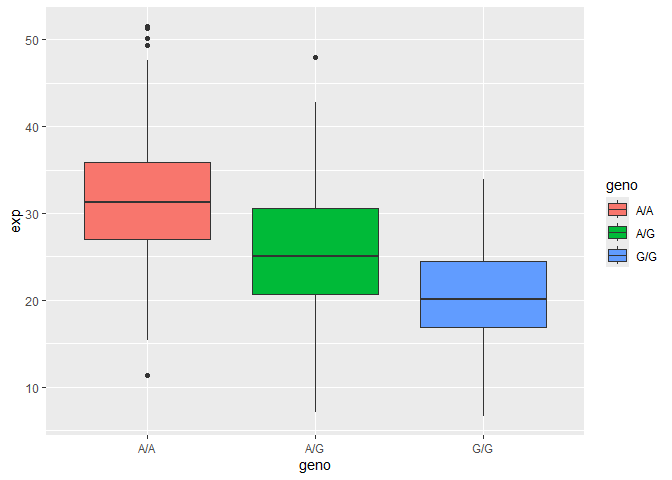
The G/G genotype decreases expression compared to A/A, based on the lower median value for G/G. The SNP decreases the expression of ORMDL3.